Shelf-life predictions for every degradant, straight from your stability table
Paste or drop your accelerated stability results. StabilityProof tidies them up, fits humidity-corrected Arrhenius models to every degradant, the total and the assay, picks the model that best predicts the data it has not seen, and gives a shelf life with its uncertainty at any storage condition.
Free to use. No account, no upload, no install.
From a messy table to a shelf life in three steps
Paste or drop your results
Excel, CSV or a table copied from your LIMS, either one column per peak or one row per result. Values like <LOQ and ND, conditions written as 50/75 or 50 °C 75% RH, and peaks whose RRT drifts slightly are all handled. Data guide
Check the columns
Columns are recognised automatically. Set limits for each degradant, the storage conditions you care about, your target shelf life and the time points to check.
Read the results
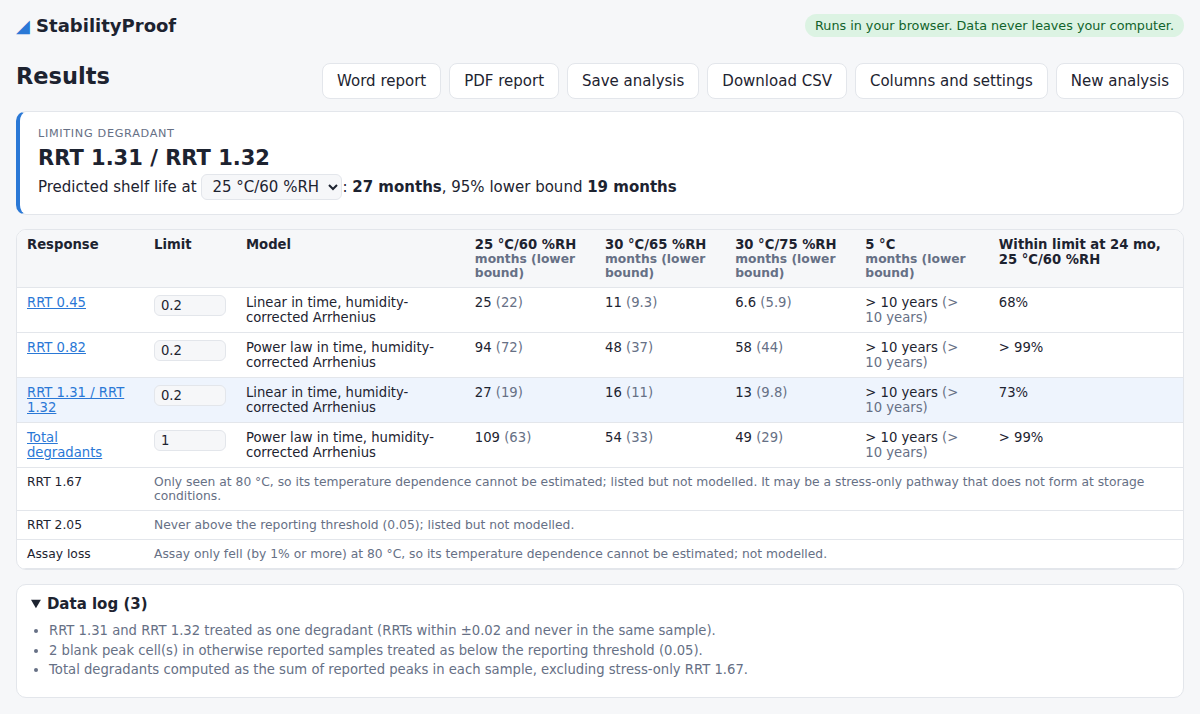
The limiting degradant, the predicted shelf life with a 95% lower bound, and the chance of staying within the limit at each time point, for every storage condition.
Same-day answers for development teams
When a new pull comes off test, paste the export and get an updated shelf-life prediction for every degradant in minutes. There is no reformatting, no fitting one peak at a time, and no waiting for a statistician's slot or a specialist software licence.
Paste the export as it is
One row per result straight from the LIMS, or one column per peak from a spreadsheet. Other tests and summary rows are set aside and logged.
Everything re-modelled automatically
Each degradant, the total and the assay are refitted and the best model chosen again, so a new pull that changes the picture shows up straight away.
Ready for the project meeting
Download a Word or PDF report with the predictions, charts, settings and every decision, ready to share the same day.
All the degradants, not one at a time
Most ASAP work means modelling the worst degradant by hand and hoping it stays the worst. StabilityProof models every peak above the reporting threshold in one go, so a slow-growing degradant that becomes limiting at 30 °C/75 %RH doesn't slip past.
Model choice, explained
Linear, power-law, first-order and plateau models plus classic isoconversion are all tried. The one that best predicts the mildest condition when it is left out wins, and the reason is shown in plain words.
You stay in charge
Lock any degradant to a model, or use validated mode to allow only the models your procedure names. Exclude a point by clicking it, with a reason that is kept.
Uncertainty you can quote
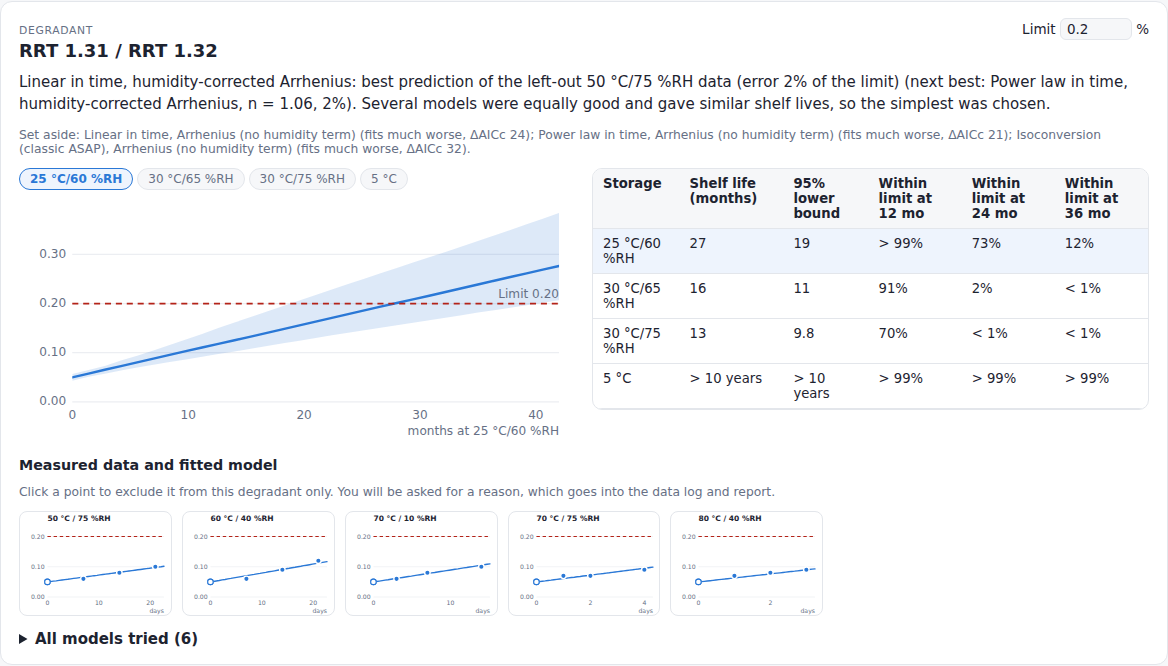
Monte Carlo sampling of the fitted parameters and the measurement scatter gives a lower bound and a probability of staying within the limit, not just a single number.
Any storage condition
25 °C/60 %RH, 30 °C/65 %RH, 30 °C/75 %RH, refrigerated or your own. Set a target of 18 months for an internal guidance or 36 for a filing.
Messy data, logged
Every adjustment, from merging two RRTs that are the same peak to treating a blank as below the threshold, is listed in a data log rather than done silently.
Save and come back
Save the analysis with your data, settings and decisions, plus a SHA-256 fingerprint of the data, and reopen it later with identical results.
A report you can file
With Pro, download the analysis as a Word or PDF report, ready to attach to a stability protocol, development report or change control.
Summary and settings
The limiting degradant, shelf life at each condition, and every limit, threshold and option used.
Audit trail
Each model you overrode and each point you excluded, with your reason, next to what the tool chose on its own.
Results by degradant
Fitted parameters with standard errors, a prediction chart, and the shelf life and probabilities at each condition.
Traceable to the data
The data's SHA-256 fingerprint, the engine version and the random seed, so the result can be reproduced.
Private by design, not by promise
Unreleased stability data is confidential. StabilityProof never sees it.
Analysed on your computer
Your browser reads the table and runs every fit locally. There is no server that receives data.
Blocked from sending data
The calculator ships with a security policy that stops it making any network request, so it couldn't upload your data even by mistake.
Check it yourself
Open your browser's developer tools, go to the Network tab and run an analysis. You'll see nothing sent. Privacy
Questions
What data do I need?
Results from at least two accelerated conditions with different temperatures, ideally the usual ASAP design of five or so temperature and humidity combinations over a few days to weeks, plus the initial time point. The data guide shows the layout and has a template.
Which models does it use?
The humidity-corrected Arrhenius equation (Waterman and colleagues), fitted globally with linear, power-law, first-order or plateau time dependence, plus classic isoconversion. The method page explains how models are compared and how uncertainty is estimated.
Does it replace real-time stability data?
No. Accelerated predictions support decisions such as formulation choice, packaging and setting a provisional shelf life. Real-time data under ICH Q1A and Q1E is still what confirms a shelf life.
Can I use it in a GMP environment?
It is built to make that easier: the audit trail of your decisions, validated mode, the data fingerprint and a fixed random seed make results traceable and reproducible. Whether and how a tool is validated for your use is decided by your quality system.
Is it free?
The full analysis is free, including every degradant, saving and CSV export. Word and PDF reports are part of Pro, and they're free too while payments are being set up. See pricing.
Try it on your own data
It takes a minute, and nothing leaves your computer.